
 ar.io Documentation
Troubleshooting
Find your symptom in the quick lookup table, then open the matching section below for the fix.
Quick lookup
| Symptom | What to check |
|---|---|
Release number is old or ends in -pre | Upgrade from the main branch. |
| Gateway shows as offline on https://gateways.ar.io | Check that https://<your-gateway>/ar-io/healthcheck answers. |
/ar-io/observer/reports/current says "Report pending" | Nothing. Wait for the report. |
| Observing your gateway shows failures | AR_IO_WALLET, ARNS_ROOT_HOST, wildcard DNS and certificates, and /chunk/<offset>. |
| Failed offset (chunk-proof) checks | Upgrade core to Release 85 or later. See Failed offset (chunk-proof) checks. |
.env changes have no effect | Restart the gateway with docker compose. |
| Out of disk space, but the disk has free space | Inode exhaustion (df -i). |
| ArNS names don't load | ARNS_ROOT_HOST in .env, and the wildcard DNS record. |
| "Your connection is not private" | Renew your SSL certificates. |
| 404 page from NGINX | NGINX configuration, and whether the gateway is running. |
| 502 from NGINX | The gateway's logs. |
| certbot can't issue certificates | Wait for the DNS TXT records to propagate. |
General troubleshooting
Troubleshooting failed epochs
Overview
Every gateway on the network runs an observer. In each epoch, up to 50 gateways are prescribed as observers. Each prescribed observer checks every gateway and submits one report, which records whether each gateway passed and why it failed.
Each observer checks each gateway 3 times in an epoch (OBSERVATIONS_PER_GATEWAY), at moments spread over a window covering half the epoch. Its report marks a gateway as failed if fewer than 2 of those observations pass (MAJORITY_VOTE_THRESHOLD). One observation passes when:
- the ownership check passes,
- at least 80% of the ArNS names checked pass, and
- the offset check passes.
A gateway fails the epoch when more than half of the observers that submitted a report mark it as failed. A gateway that fails an epoch gets no gateway reward for it. If it was also a prescribed observer and submitted its report, it still gets its observer reward.
To diagnose a failure, first try to load data from the gateway in a browser. If that doesn't show the problem, read the observer reports.
Manual observation
You can run an observation of any gateway at any time from the Network Portal:
- Open the Network Portal.
- Select the gateway from the list of gateways.
- Click Observe, at the right of the gateway's header, next to Reports.

- Check the ArNS names field, at the right of the Observe header. It holds the current epoch's prescribed names. You can change them or add more, separated by commas.
- Click Run Observation, next to the field.
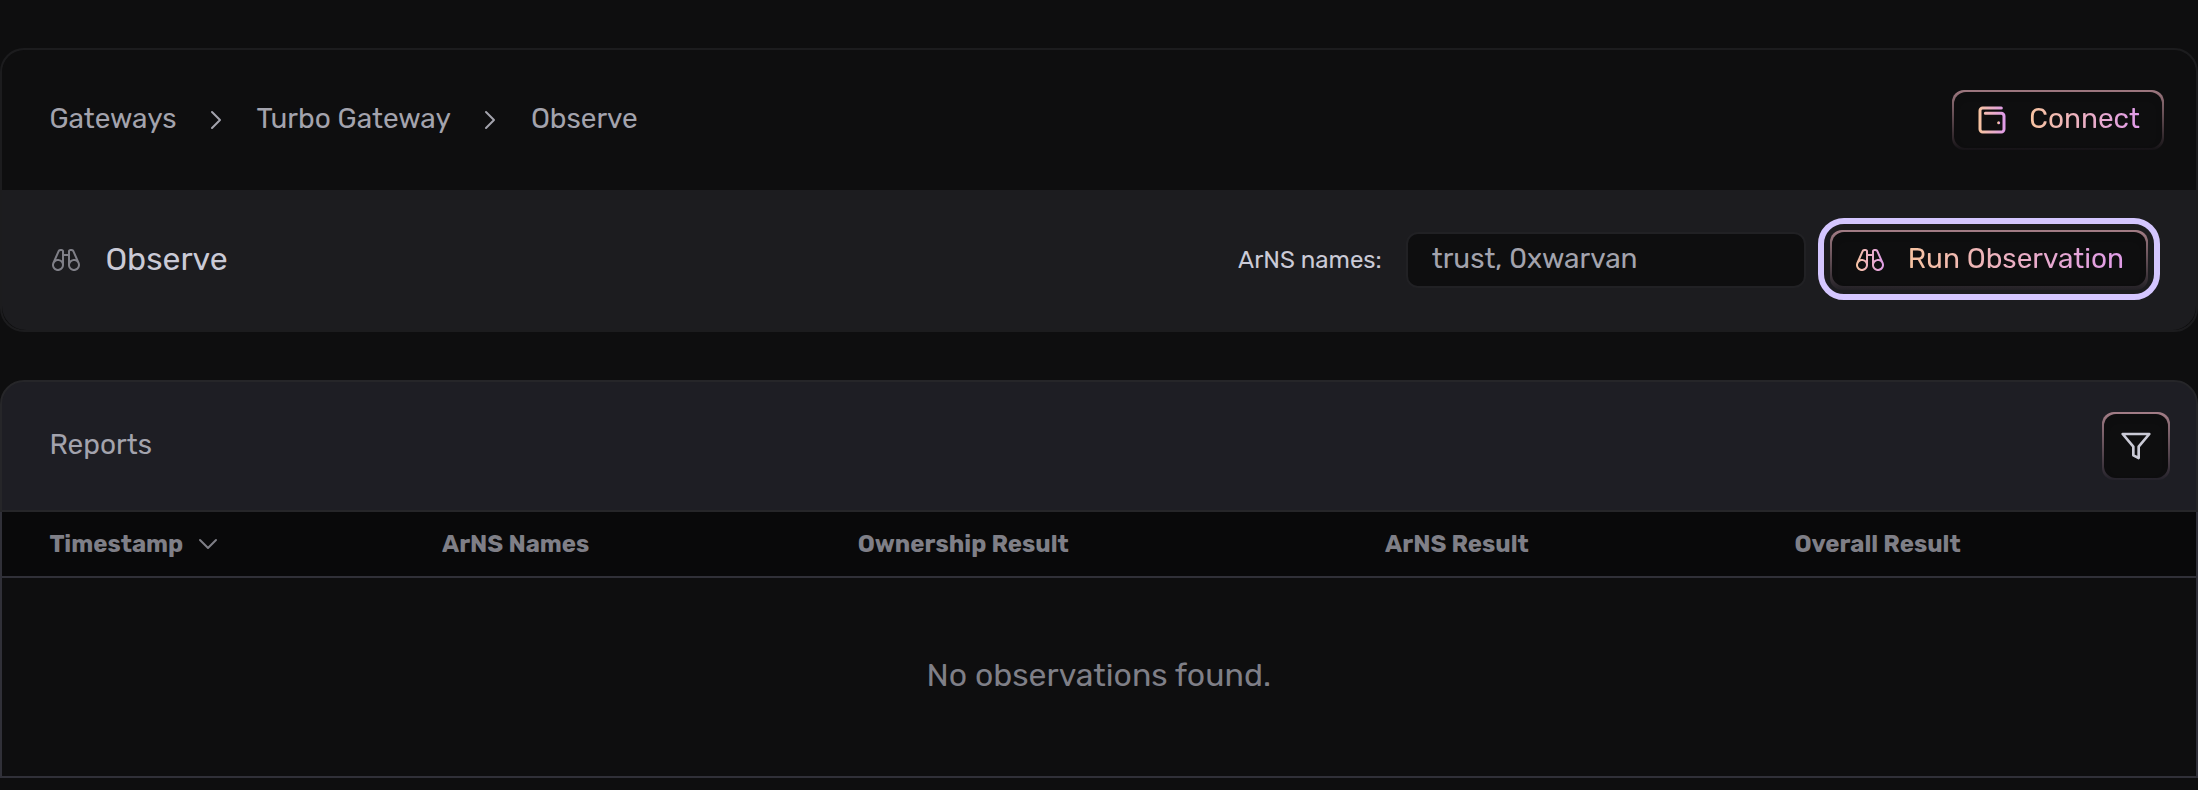
The results open in the Observation Details panel on the right. The observation also appears in the table below the header, saved in your browser, where you can click it to open it again.
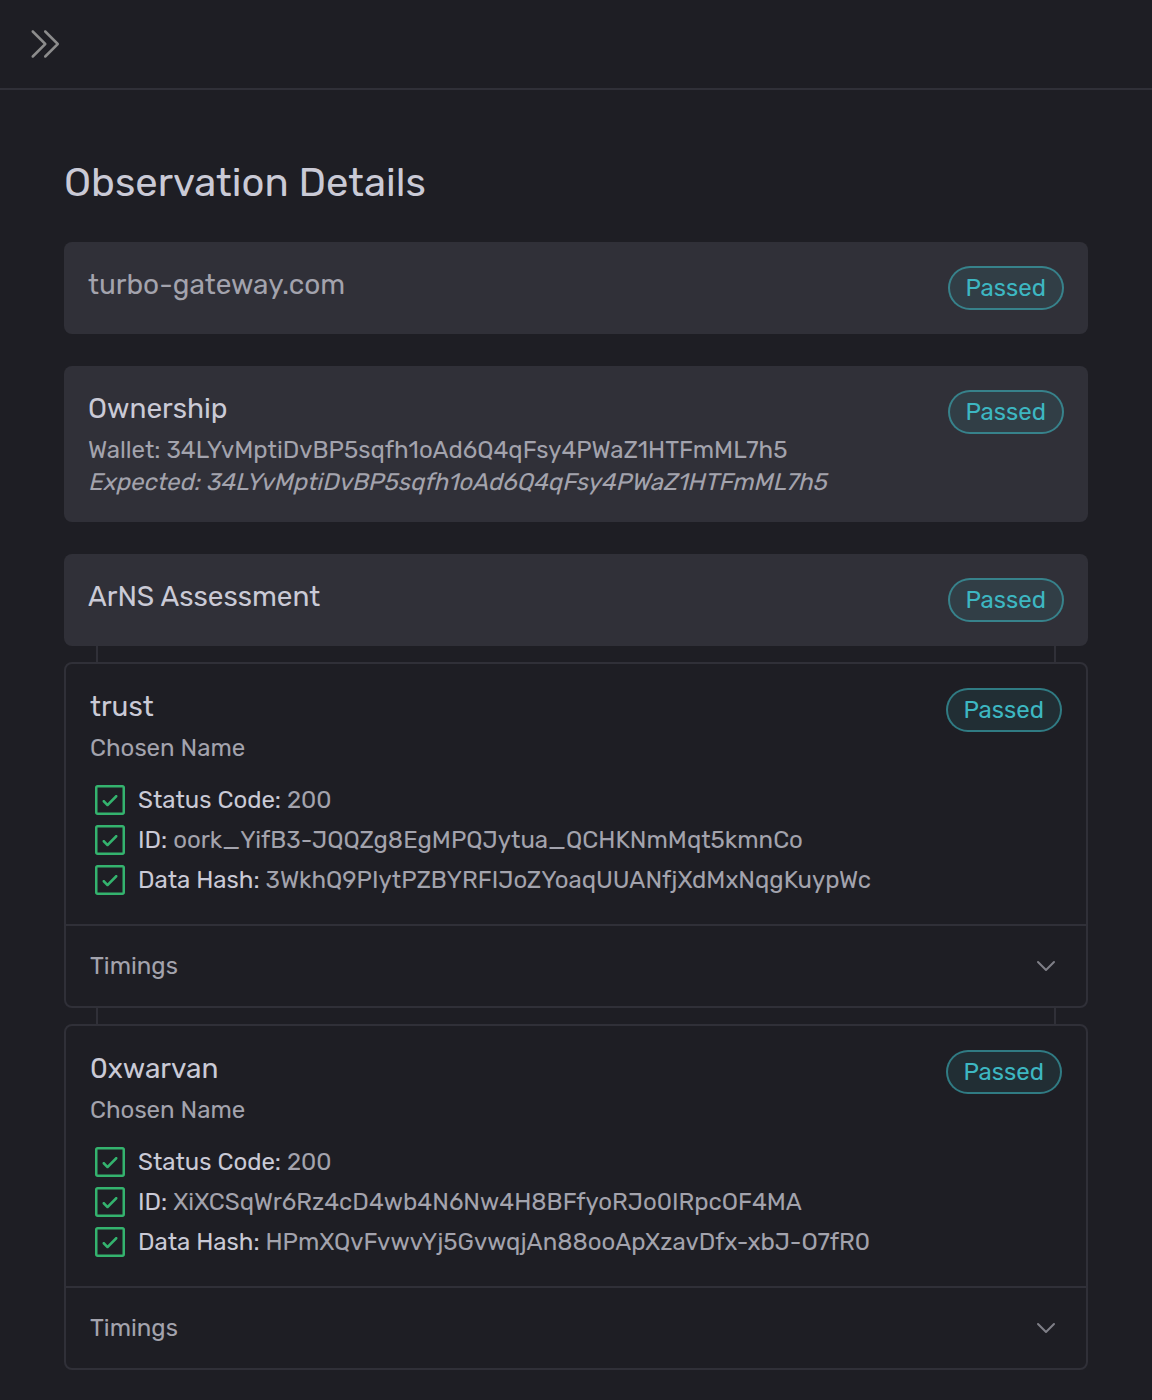
A manual observation runs the ownership and ArNS checks from your browser, once. It doesn't run the offset check, and it isn't a majority of 3, so it can pass where an observer's report failed.
Accessing the observer report
To read the reports that failed a gateway, use the Network Portal:
- Open the Network Portal.
- Select the gateway from the list of gateways.
- In the Observations of this gateway panel, select the epoch from the dropdown on the right. The panel lists the observers that failed the gateway in that epoch. Click Read why to list each observer's reasons in the panel.
- To open an observer's full report, click the View Report button to the right of that observer's address.
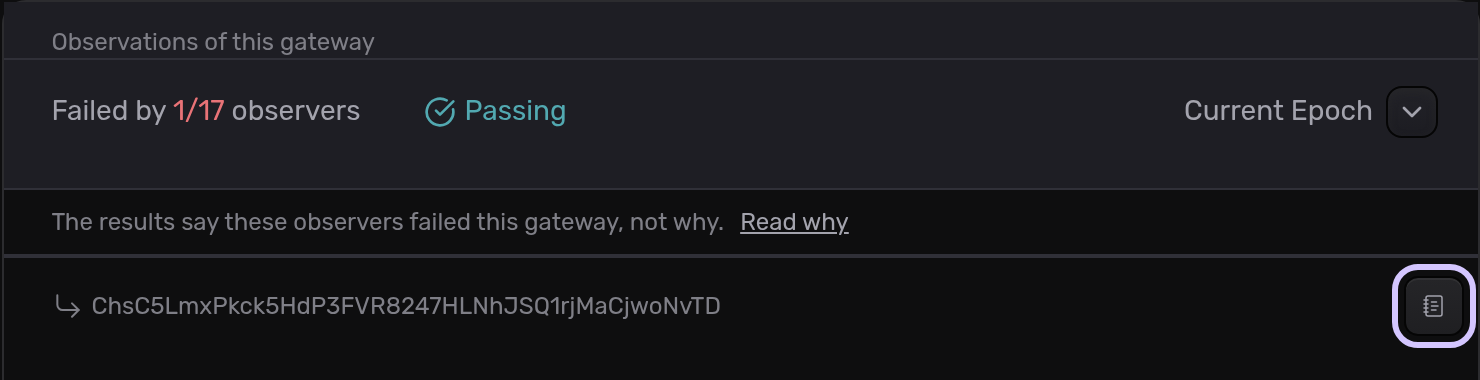
- In the report, find your gateway in the Observed Host column and click its row. The Observation Details panel opens with that gateway's results.
Understanding the observer report
For each ArNS name checked, the report shows what the observer expected, what your gateway returned, and a failure reason if the check failed. The failure reason is the error message the observer got, or the list of fields that didn't match. Below are the most common reasons and how to fix them.
Timeout awaiting 'socket', or Timeout awaiting 'connect'
Timeout awaiting 'socket' for 7000msTimeout awaiting 'connect' for 5000msThe observer couldn't get an answer from your gateway in time. It allows 5 seconds for the DNS lookup, 5 seconds to connect, 2 seconds for the TLS handshake (secureConnect), and 7 seconds of silence on an open connection (socket).
Many causes have nothing to do with your gateway. A few of these failures among many passing checks are not a problem.
If most or all names fail this way, the observer can't reach your gateway at all. Check by:
- opening your gateway in a browser,
- running a manual observation, and
- using
curlorpingfrom another network.
If those fail too:
- Check Docker and the gateway's logs to see if the gateway is running.
- Check that the SSL certificates are valid for your gateway's domain.
- Check your domain's DNS records. Wrong or conflicting records cause connection problems.
Some operators running gateways on home networks have found their internet provider blocking, throttling or delaying traffic to the gateway. If nothing above helps, ask your provider.
Grafana shows your gateway's ArNS resolution times. If they stay high, make sure the gateway runs the latest release.
Cert has expired
certificate has expiredYour gateway's SSL certificate has expired. Renew it, point your reverse proxy (NGINX or another) at the new certificate, and restart the proxy.
dataHashDigest mismatch
dataHashDigest mismatchYour gateway answered, but the hash of the data it returned differs from the hash of the observer's reference copy. The reason can list other fields that differed too, for example contentType mismatch, dataHashDigest mismatch. Causes:
- Your gateway cached a JSON wrapper instead of the data (before Release 88). arweave.net, one of the default trusted gateways, answers some requests with a JSON document describing the data instead of the data itself. Before Release 88, a gateway that fetched from it could cache that wrapper and serve it as the item, with the wrong hash and content type. Release 88 fixes the fetch, but copies cached before the upgrade keep being served until you purge them. See Purging cached JSON wrappers.
- The gateway returned cached data that is older than the current data on the network. This happens occasionally and resolves itself.
- The gateway runs on testnet or devnet. Gateways joined to the ar.io network must run on mainnet to pass observation. If most or all names fail with this reason, check this first.
- The gateway returns fraudulent data on purpose. This takes rewriting the gateway's code, and catching it is a main purpose of the Observation and Incentive Protocol.
The bundled observer uses your own gateway (ARNS_ROOT_HOST) as its reference, or turbo-gateway.com and ar-io.net when ARNS_ROOT_HOST isn't set. It doesn't use a gateway as its own reference while another reference can answer.
Purging cached JSON wrappers
A wrapped copy starts with {"accept-ranges". Take the ID from the report (the resolved ID of the failing name), and check what your gateway serves for it:
curl -s https://<your-gateway>/<id> | head -c 32; echoIf the output starts with {"accept-ranges", make your gateway forget its record of that ID, so the next request fetches the data again. This needs Release 88 and your ADMIN_API_KEY:
curl -X POST 'http://localhost:3000/ar-io/admin/invalidate-data' \
  -H 'Authorization: Bearer <ADMIN_API_KEY>' \
  -H 'Content-Type: application/json' \
  -d '{"id": "<id>"}'
The answer is {"id":"<id>","removed":true}, or "removed":false if the gateway had no record of the ID. This doesn't reach caches in front of the gateway. If you run an NGINX cache or a CDN, purge the ID there too, for example with the cache bypass header.
Response code 502 (Bad Gateway)
Response code 502 (Bad Gateway)The observer reached your server, but your reverse proxy answered 502. This is almost always a reverse proxy problem. Check that the proxy is running and forwards requests to the gateway.
On NGINX, test the configuration with sudo nginx -t. If it has no errors, reload NGINX with sudo nginx -s reload.
The gateway itself may also be stopped. Check Docker and the gateway's logs.
Response code 503 (Service Unavailable)
Response code 503 (Service Unavailable)The observer reached your server, but the reverse proxy couldn't get an answer from the gateway behind it. The cause is usually temporary: the gateway is overloaded or restarting. One or two of these in a report are not a problem. If every name in the report fails this way, the gateway has probably crashed. Restart it.
connect EHOSTUNREACH
connect EHOSTUNREACH <gateway-ip>:443The observer found no network route to your gateway's IP address. This is almost always a DNS or network problem. Check that your domain's DNS records point at the right IP address, and that your firewall and router let connections in on port 443. Your reverse proxy's logs may show more.
getaddrinfo ENOTFOUND
getaddrinfo ENOTFOUND <arns-name>.<gateway-domain>The observer couldn't find a DNS record for the name. Your gateway probably has no valid DNS record for its domain, or for the wildcard subdomain ArNS names need. One or two of these in a report can be a temporary problem with the observer's DNS server. If every name in the report fails this way, your DNS records are missing or wrong.
Hostname/IP does not match certificate's altnames: Host: <gateway-domain>. is not in the cert's altnames: DNS:<gateway-domain>
Hostname/IP does not match certificate's altnames: Host: <arns-name>.<gateway-domain>. is not in the cert's altnames: DNS:<gateway-domain>Your gateway's SSL certificate doesn't cover the name the observer requested. In the example, the certificate covers only the gateway's domain, not the wildcard *.<gateway-domain> that ArNS names are served on. The same error appears when a gateway changes domain and keeps the old certificate. Get a certificate that covers both the domain and its wildcard, point your reverse proxy at it, and restart the proxy.
write EPROTO <connection-id>:error:<error-code>:SSL routines:ssl3_read_bytes:tlsv1 unrecognized name:<path-to-openssl-source>:SSL alert number 112
write EPROTO <connection-id>:error:0A000458:SSL routines:ssl3_read_bytes:tlsv1 unrecognized name:<path-to-openssl-source>:SSL alert number 112Your server has no certificate or server block for the name the observer requested. This almost always means the gateway has no certificate set up for its wildcard subdomain. Get a certificate that covers the wildcard, point your reverse proxy at it, and restart the proxy.
Failed offset (chunk-proof) checks
From Release 85, observers check that gateways serve chunks. By default every gateway is checked in every epoch (OFFSET_OBSERVATION_SAMPLE_RATE, 1.0). An observer that sets a lower rate checks a share of gateways, the same share as every other observer at that rate.
A checked gateway must serve /chunk/<offset> with a Merkle proof that validates against the chain. The observer tries up to 4 offsets (OFFSET_SAMPLE_COUNT) and stops at the first that validates, so a gateway fails only when every offset fails. Timeouts, error statuses and bad proofs all count as failures.
By default a failed offset check fails the observation (OFFSET_OBSERVATION_ENFORCEMENT_ENABLED=true), like a failed ownership or ArNS check, and the 2-of-3 majority still applies. If the observer couldn't judge the check because its own lookups failed, it records the check as inconclusive, which never fails a gateway.
The report lists the samples of the observer's best observation of your gateway under offsetAssessments. Each failed sample names its offset and a failureCategory:
failureCategory | Meaning |
|---|---|
timeout | The gateway didn't answer /chunk/<offset> in time. |
network | The connection failed: DNS, refused, TLS or reset. |
http_status | The gateway answered with an error status. A 404 means it couldn't serve the chunk. |
invalid_chunk | The response wasn't a usable chunk: not JSON, an empty or oversized chunk, or a missing or unreadable data_path. |
bad_proof | The data_path Merkle proof doesn't validate against the chain. |
unverifiable | The gateway served a chunk, but the observer couldn't check it against the chain because its own lookups failed. It never counts as a pass. A check is inconclusive only when all its samples are unverifiable. |
To fix it:
-
Upgrade core to Release 85 or later. Release 85 fixed chunk fetches that answered
404for chunks the network holds. A gateway now asks the preferred Arweave nodes first, in the order that serves it best from where it runs, and tries up to 8 peers per chunk instead of 5 (ARWEAVE_PEER_CHUNK_GET_MAX_PEER_ATTEMPT_COUNT). -
Test the offset yourself, with an offset from the report:
curl -s -o /dev/null -w '%{http_code}\n' https://<your-gateway>/chunk/<offset>200means your gateway served the chunk.404means no source it tried had the chunk. From Release 88,503means it couldn't fetch the chunk in time. -
Allow for warm-up. After each restart, a gateway needs about 100 chunk requests to learn which preferred nodes serve it well. Until then, chunk fetches fail more often.
-
Check your own node lists. If you set
PREFERRED_CHUNK_GET_NODE_URLSorPREFERRED_CHUNK_POST_NODE_URLS, removetip-5.arweave.xyz. Release 85 dropped it from the defaults because it stopped answering.
FAQ
Getting help
If you're still stuck, ask in the ar.io community Discord.
Once your gateway runs smoothly, see Manage your gateway for guides on tuning, monitoring and more.
How is this guide?